Racing Report: Full Year 2024
By Richard Wayman, Director of Racing
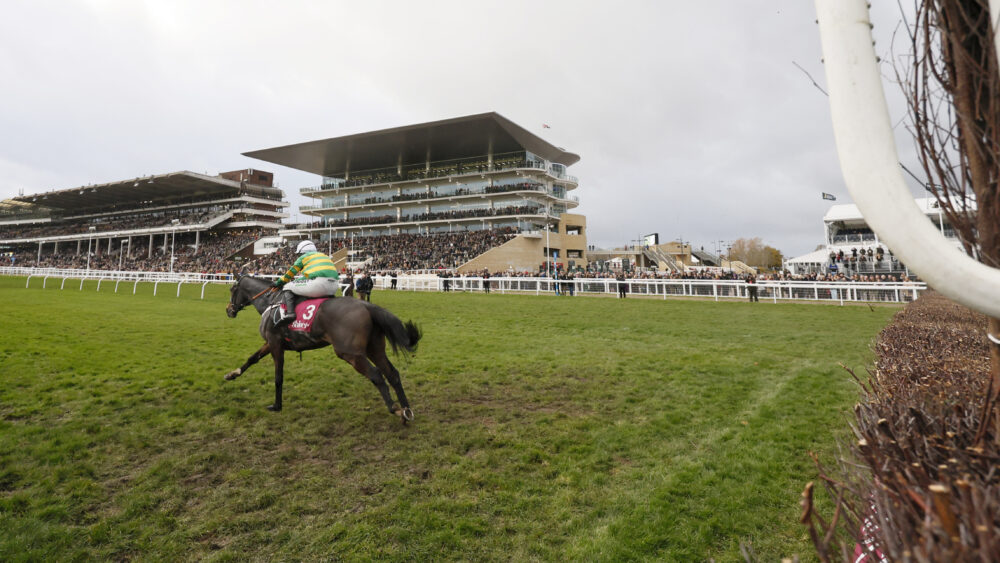
2024 provided many memorable moments on Britain’s 59 racecourses including the running of the Longines World’s Best Horse Race at York in August. Congratulations to everybody involved with the 2024 Juddmonte International Stakes, a race that will live long in the memory.
It was also the first year of the two-year trial of fixture list changes that were designed with the aim of supporting the future of our sport by making racing more attractive to fans and customers.
A key part of the trial is premierisation which, in a sentence, is all about making the most of our biggest fixtures to grow interest in racing, ultimately at all levels. More specifically, this involved creating a tiered fixture list to help fans identify our headline events, investing in the prize money and boosting the quality at Premier racedays, reducing some of the congestion in the fixture list around those major meetings and differentiating the experience for customers at these elite meetings compared with the rest of the fixture list. Other elements of the trial included making much more of Sundays and also improving the competitiveness of British racing from top to bottom.
Throughout last year, we published regular reports of key racing data and the latest edition that covers all of 2024 is now available. Alongside that and to help us measure the effectiveness of the changes within the trial, we also published twelve targets and the purpose of this blog is to provide a half-time report on the trial including summarising the lessons we have learnt so far.
Betting related targets
The disappointing headline is that total betting turnover on British racing has fallen by 6.8% compared with last year, and 16.5% compared with two years ago. There are several factors impacting that decline, many of which have nothing to do with the fixture list trial. I’ve no doubt that these are headed by the impact of affordability checks and the extent to which they have resulted in people either stopping betting or placing their bets with unlicensed operators where such checks don’t take place.
More positively, the decline in total betting turnover since August has slowed to less than 1%, albeit with more races run compared with the same period in 2023, the average race turnover is down by just over 4%. It is obviously our hope that these improved trends in the final few months of 2024 continue into 2025.
Target 1
Total betting turnover on the 33 Saturdays with only three fixtures in the protected window to outperform the other 19 Saturdays by 6 to 7%.
To better spread Saturdays, we limited the number of fixtures run between 2pm and 4pm to 3 on Saturdays including a Group or Grade 1, and 4 on other Saturdays.
Measuring the impact of this initiative is proving challenging, not least because of the differences that occur in the fixtures run on Saturdays from week-to-week, and indeed between years (primarily due to abandonments). A further complicating factor is the positioning of other major sporting events. For example, turnover on two of our major summer Saturdays when there were only three fixtures in the protected window (Royal Ascot and the Coral Eclipse at Sandown) were both impacted by clashing with the 2024 Euros, making them difficult to compare with the equivalent Saturday in 2023.
What we can decipher from the data is that, on average, those afternoons in the winter when there were only three fixtures between 2 and 4pm slightly outperformed Saturdays when there were four. However, that hasn’t been the case in the summer, albeit that, as mentioned above, there have been other factors impacting some of our higher profile Saturdays when we have had just the three fixtures taking place in the middle of the afternoon.
The picture is clearer if we concentrate on the gaps between races on Saturday afternoons, when it is evident that for major events, a longer build up into a race (10 minutes or more) continues to see betting turnover on that event grow. Conversely, for other races, a shorter lead time (5 minutes) supports increased betting activity but a longer build up generates limited further upside. This is exactly the sort of insight that we hoped to get from the trial and, if that trend continues through 2025, will mean that we can develop a more nuanced approach to decongesting of races in the future.
Target 2
Total betting turnover on Sunday evening fixtures to outperform midweek (Tuesday to Thursday) floodlit fixtures by 15 to 20%.
This target related to the trial of six fixtures staged in the first quarter of 2024. As was reported at the time, this wasn’t achieved with total digital turnover averaging only 3.6% higher than midweek floodlit fixtures. As a result and having also considered feedback from those involved in servicing the meetings, the trial has not been continued at this time.
Target 3
Slowing the decline in betting across the entire fixture list compared with 2023, with Premier racedays showing 1-2% better relative performance than the remainder of the fixture list.
Our analysis of the betting performance at Premier racedays shows that there is plenty of variation within that group of fixtures. The overall number shows that Premier racedays have underperformed compared with other fixtures, the average decline in turnover per fixture being 7.5% at Premier and 5.9% at Core.
Some context is required, however, so that we can really understand these headline numbers. One approach to this is dividing Premier racedays into four different categories: Major Festivals, Saturdays, Existing Premier racedays on days other than Saturday, and New Premier racedays (i.e. where the fixture replaced a much smaller meeting where there was considerably less prize money on offer or is an entirely new meeting).
Average turnover per fixture at the Major Festivals has suffered the greatest decline, falling by 12.4%. We believe there were a number of factors contributing to this including competitiveness issues and the abandonment of a race at Cheltenham, the Grand National being run earlier in the afternoon, and as previously mentioned, Royal Ascot clashing with the Euros. In addition, there have been fewer concessions and promotions offered to customers at these major meetings which the bookmakers have said is largely in response to rising costs.
The performance at the other Premier racedays was generally better than the rest of the fixture list with the decline on Saturdays averaging 3.8%, existing meetings on other days of the week 3.4% and at new meetings 2.9%. So, whilst acknowledging that all the different categories show betting numbers in decline, away from the Major Festivals, the relative performance at Premier racedays is better than the remainder of the fixture list.
Attendance related targets
Target 4
To halt the decline in total attendances at Premier Fixtures in 2024 and then increasing by 5-10% in 2025 versus 2023.
The environment faced by racing, as well as other sports and leisure pastimes, has created a challenging environment to achieve our racegoer related targets. In addition, there was no national marketing campaign for racing in 2024 and therefore the promotional effort was predominantly driven by the individual efforts of racecourse groups and independent racecourses.
The headline numbers on racegoers are that total attendances were 4,799,730, down by 0.7% from 4,833,944 in 2023. With fifteen fewer fixtures completed, however, the average attendance grew marginally by 0.4% to 3,404 from 3,392.
As with the betting-related information, making direct year-on-year comparisons for Premier racedays is not entirely straightforward given the impact of abandonments (both the number and the particular fixtures lost). It must be acknowledged, however, that our target to avoid a decline in attendances at these meetings was not achieved, with total attendances at these meetings falling from 2,012,929 to 1,977,553. The 2024 levels were close to 2022, when total attendances at these meetings totalled 1,979,602.
Target 5
With 41 Saturdays moving from their traditional start times and four fewer fixtures, that Saturday attendances will have recovered to within 25,000 of their current levels by 2025.
There were nine fewer fixtures staged on Saturdays in 2024 compared with 2023 and therefore this target is best judged by average attendances. These fell very marginally, from 6,497 in 2023 to 6,480 in 2024. So, taking account of the fewer fixtures staged, the movement of the 41 fixtures from their traditional start time doesn’t appear to have had a material impact on the total number of people going racing on Saturdays in 2024.
Viewer Related Targets
Target 6
Recognising the impact on those streaming, watching the racing channels or for customers in betting shop, the target is to reduce the number of clashing races (defined as a British or Irish race running into a British race) on Saturday afternoons (up to 5pm) in 2024 from 8% to 5%.
The efforts to spread racing more evenly across Saturdays has resulted in a reduction in the number of races clashing. The percentage of races clashing on Saturdays before 5pm has fallen from 11.1% in 2022, to 7.9% in 2023 to 5.8% in 2024, albeit that there has been a small increase in the number of clashes later in the day. So, good progress is being made albeit there is still more we would like to achieve in this area in 2025.
Ownership Related Targets
Target 7
To increase the number of horses that race in Britain by 2.5% by 2025 compared with 2023.
Although this target is for 2025, we should acknowledge that horse numbers remain under pressure, with the total number of horses that ran at least once declining by 178, or 1.0%, from 18,630 in 2023 to 18,452 in 2024.
Splitting this between codes (and noting that some horses appear under both codes), the number of horses running on the Flat has increased by 0.5%, whilst the number running over Jumps has fallen by 3.0%.
Target 8
To increase the number of horses rated 85+ on Flat and 130+ over Jumps. On the Flat, to increase by 5% in 2024 and a further 5% in 2025. Over Jumps, to increase by 2.5% in 2024 and a further 2.5% in 2025.
This target has not been met under either code, albeit there has been contrasting results. 2,052 individual Flat horses achieved a BHA performance figure of at least 85 during 2024. This is up from 1,983 in 2023, thereby representing an increase of 3.5%, just short of our 5% target.
The situation over Jumps is much more concerning with the number of horses running to a BHA performance figure of at least 130 declining from 787 to 716, or 9.0%. This is clearly a major issue, particularly as it continues a trend that stretches back to 2020/21. Whilst adjustments to the handicapping rating file starting in 2021 will have contributed to these bare numbers, there is clearly much more going on here, particularly around the supply chain of quality Jump horses to and within Britain. As we’ve said in previous blogs, this is a key area of focus for the BHA and others across the sport as we develop plans that seek to reverse this decline. Of course, that won’t happen overnight – not least given the time-lag between foaling and racing Jump horses in particular – but there are steps we can take to support our owners, trainers and breeders in growing the number of high-quality Jump horses bred and trained in Britain. A programme of work aimed at addressing this issue is under way, with a progress report to follow later in 2025.
Target 9
Total prize money at Premier Fixtures to increase by £6-7m in 2024 and for total prize money at the remainder of the fixture list to return to close to their current levels by 2025.
This target was met with prize money in 2024 being in line with our forecasts. Total prize money at Premier racedays increased by £7.33m.
With this involving £1.9m of HBLB funding being redirected from Core fixtures to Premier racedays, it was expected that there would be some reduction in prize money at these other meetings. In total, prize money at Core fixtures fell by £3.64m, with the overall increase in total prize money therefore being £3.69m.
Looking to the future, the Levy Board has agreed that it will contribute an additional £1m to Core fixtures in 2025. This will be allocated through the Levy Board’s ratecard mechanism in a way that also rewards additional prize money contributions from racecourses, and we would therefore hope to see some recovery in prize money at Core meetings in 2025.
Competitiveness-related targets
(The following three targets are addressed collectively)
Target 10
To grow average field sizes at Premier and Core fixtures in 2024, both Flat and Jump, compared with 2023.
Target 11
To grow the percentage of races with 8+ runners at Premier and Core fixtures in 2024, both Flat and Jump, compared with 2023.
Target 12
To grow the percentage of races with an odds-against favourite at Premier and Core fixtures in 2024, both Flat and Jump, compared with 2023.
The changes made to the fixture list and race programme in 2024 have undoubtedly had a positive impact on race competitiveness. These included programming 300 fewer Jump races, moving Flat races out of the summer into the autumn and also making a variety of changes to the race programme.
Our targets cover three separate measures of competitiveness: average field sizes, the percentage of races with at least eight runners and the percentage of races with an odds against favourite. These measures largely track each other and, therefore, for the purposes of the blog, we have just focussed on average field sizes.
At a headline level, on the Flat average field sizes are the highest they have been since before the pandemic. Over Jumps, excluding 2020 and 2021 which were both impacted by the lengthy suspension of Jumps racing due to the pandemic, this year’s average field sizes were the best they have been since 2016.
So, progress has been made and, on the Flat, that applies to both Premier and Core meetings. Flat Premier racedays have seen average field sizes increase from 10.50 in 2023 to 10.86 in 2024. At Flat Core meetings the improvement has been from 8.89 to 8.93.
Over Jumps, the average field sizes at Core meetings have improved from 8.01 to 8.40. Linked to the comments above concerning the decline in higher rated Jump horses, the average field size at Jump Premier racedays has fallen from 9.69 to 9.22. That is still an improvement on 2022 (9.07), but this provides further evidence that reversing some of the current trends in the upper echelons of Jump racing is our most pressing priority.

Conclusion
At the beginning of the trial, we were clear in saying that we wanted to try some things within the fixture list, which really hadn’t changed very much for many years. It was always likely that some of the initiatives would work better than others, and, of course, that is the point of trialling things and learning as we do.
As we now begin to think about the 2026 fixture list and beyond, initial conclusions include that the field-of-play related changes have largely been in line with expectations albeit the problems within the top end of Jump racing are going to require more than some changes to the fixture list and race programme.
The customer related targets were set at a time when they were already in decline and we must acknowledge that, for a variety of reasons, addressing these areas has proved challenging. There are some green shoots, however, not least the levelling out of betting turnover in the final few months of last year but, clearly, there is much to think about as plans for 2026 are developed. Our next report will be published at the end of Q1.